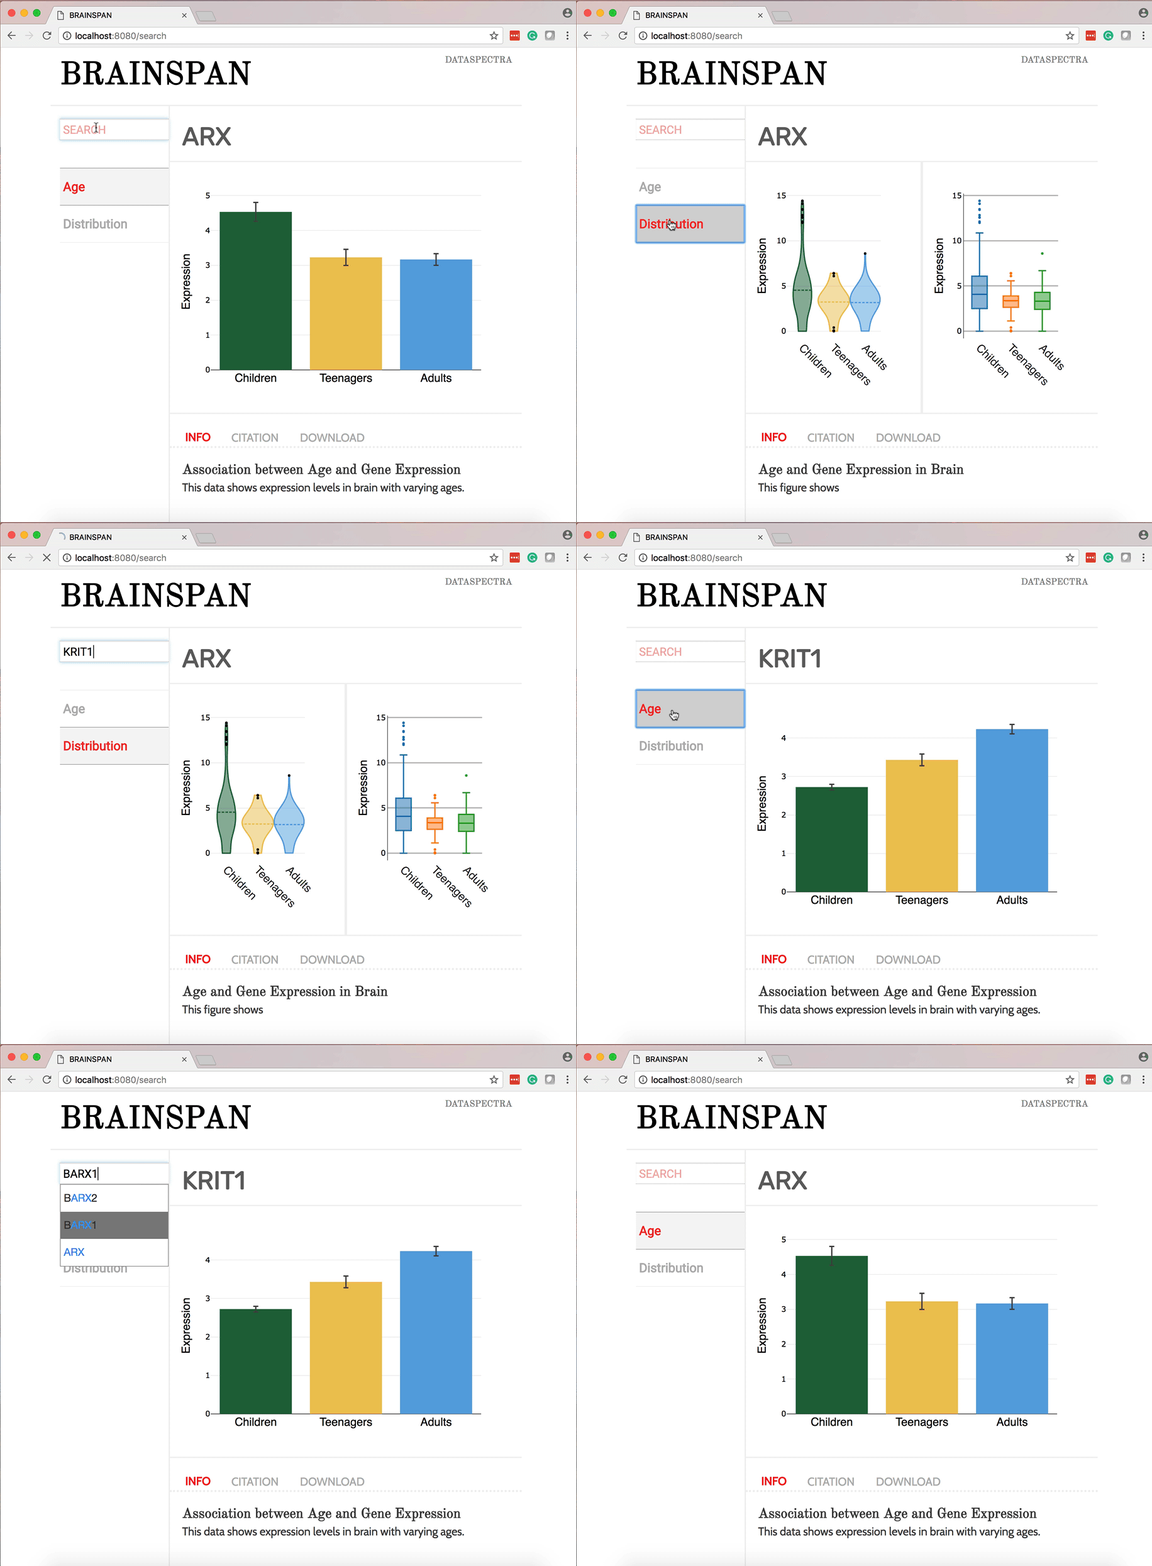
Want a really easy way to visualize your large datasets?
No coding required!

Want a really easy way to visualize your large datasets?
No coding required!
Dataspectra is an open-source tool that creates interactive web visualizations for your large datasets.
It is designed for datasets with one primary search term - e.g. cities, movies, genes. As users search for their terms, the plots will change.
The process to create your own site has 3 steps and takes less than 30 minutes of work.


Customizable plots and layouts
The layouts are designed by you in an easy to use web interface.
Setup is easy and no coding is required.
Changing a figure from one type to another can be done with a click of the button
Watch the tutorial videos to get started!
Frequently Asked Questions
Why should I use Dataspectra instead of other tools?
Dataspectra is designed for simple, user-friendly web visualizations. Other tools can do this too you may find some at the AI Database. Those other tools, however, take more setup time, can cost more, may require an existing website, or require specific coding knowledge. Generally, use Dataspectra if you want something simple and free-standing with very little time (less than 30 minutes of work and less than 30 minutes to learn).
What are the requirements for Dataspectra?
Dataspectra can be run on any system with a web browser. Since the majority of the work is done on the web, all it requires is the Google Cloud SDK to get started. The tutorial is implemented in Mac.
Questions?
ryo@dataspectra.org